What is data wrangling?
Data wrangling is the process of transforming raw data or unstructured data into a more usable form. In other words, it is the art of turning data into a useful form for visualisation and analysis.
There are four important steps in data wrangling:
1. Discovery: Getting to know your raw data. You look at it and ask, “What information do I have? Where are the problems?”
2. Cleaning: Fixing the immediate problems:
Handling missing values (e.g., a blank cell in an address field).
Removing duplicates (e.g., the same customer entered twice).
Correcting inconsistencies (e.g., “California” in one row and “CA” in another).
3. Structuring/Transforming: Getting the data into the right shape:
Making sure all dates and currencies are in the same format.
Combining multiple tables into one single dataset.
Renaming weird column headers to something understandable.
4. Validating/Publishing: Checking that the final cleaned data makes sense and then saving it in a format that your analysis tools can easily use.
Transformation refers to the reordering of the rows of data, adding new names to variables, or simply renaming the variables; data resulting from such steps is said to be tidied up. The tidyverse package is a highly efficient and interactive package for performing all these three steps by using a very simple syntax which enables the user to communicate data effectively. It is notable that tidyverse package is probably one of the most popular packages that allows users to organise data in a consistent way.
In summary:
Data Wrangling is taking data that is often messy, inconsistent, and scattered, and whipping it into shape so that you can trust it and use it to find accurate, meaningful insights.
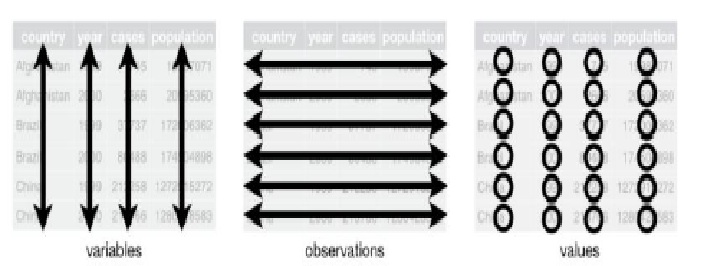
Figure 1: Tidy form of Data
Source: https://ggplot2-book.org/index.html
The goal of the tidyverse package is to put data in what is known as a tidy form. Each column in the data refers to a variable or a feature. For example, the first column could be age, the second column could be gender, etc.
Each row in the data refers to a specific observation or sample. The first row could correspond to the first customer or to the first patient, etc. Each value should correspond to a particular cell. So, for example, if the first row of the first column is referred to, then one is referring to the age of the first student or the first patient. This is known tidy format. It helps in analyzing the data and visualizing.
Key Concepts & Philosophy
The Tidyverse is built around the concept of “Tidy Data,” which adheres to three main rules:
- Each variable forms a column.
- Each observation forms a row.
- Each type of observational unit forms a table.