What are Data Structures in R?
Data Structures define how multiple data values are organized, related, and stored in memory so they can be efficiently processed, searched, filtered, sorted, and analyzed.
Core Data Structures
- Vector – One‑dimensional homogeneous data
- Matrix – Two‑dimensional homogeneous data
- Array – Multi‑dimensional homogeneous data
- List – Heterogeneous container
- Data Frame – Two‑dimensional heterogeneous structure
- Factor – Categorical data representation
Comparison Table
| Structure | Dimension | Data Type | Primary Use |
|---|---|---|---|
| Vector | 1D | Same | Lists of numbers/text |
| Matrix | 2D | Same | Mathematical computation |
| Array | Multi | Same | Scientific simulations |
| List | Multi | Different | Mixed information |
| Data Frame | 2D | Different | Real datasets |
| Factor | 1D | Categorical | Classification models |
Conceptual Diagram Description
Visualize layers of storage shelves:
- Vector → Single shelf
- Matrix → Grid shelf
- Data Frame → Spreadsheet shelf
- List → Mixed item shelf
Matrix in R
Definition
A Matrix is a two‑dimensional rectangular data structure consisting of rows and columns where all elements must belong to the same data type.
Creation
my_matrix <- matrix(1:9, nrow = 3, ncol = 3)
Accessing Elements
my_matrix[2,3]
Key Characteristics
- Homogeneous data
- Fast arithmetic operations
- Suitable for Linear Algebra, Statistics, Machine Learning Algorithms
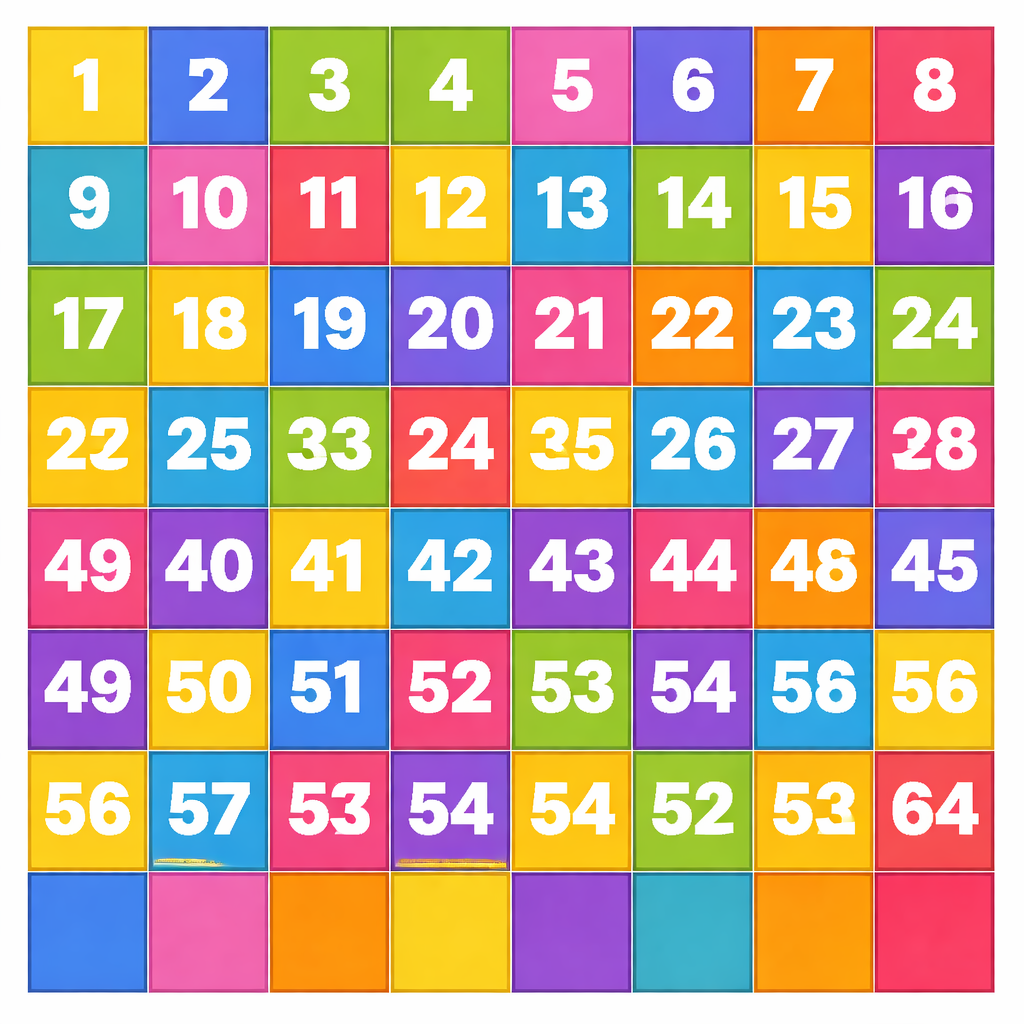
Diagram Description
A chessboard grid where each square holds a number.
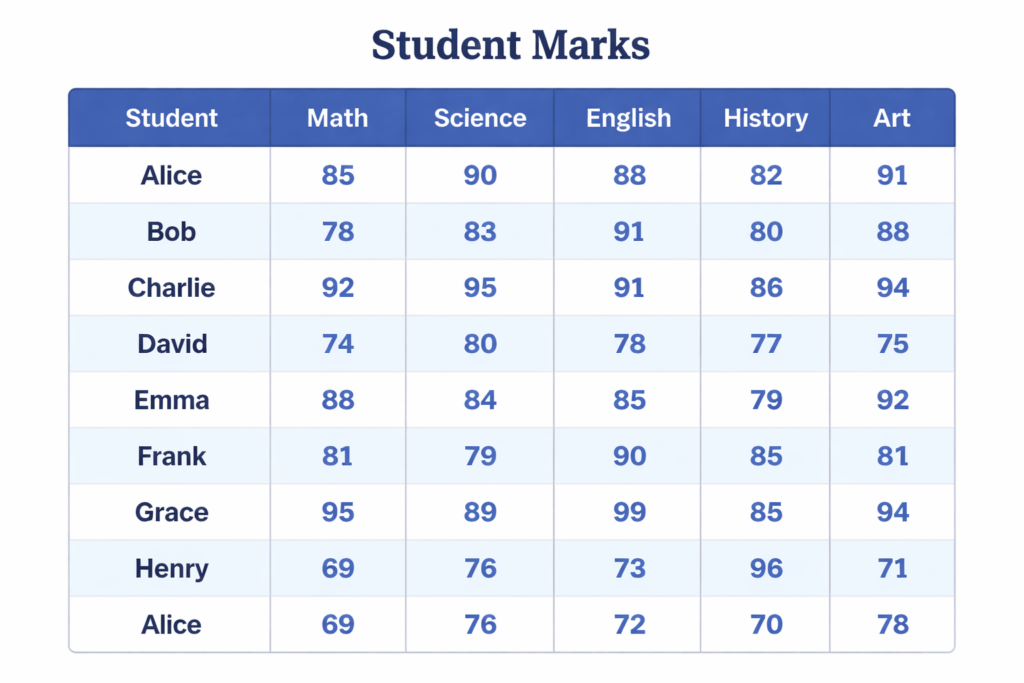
Real‑World Example
Student marks table where all values are numeric.
Interview Insight
Why choose matrix over data frame?
When uniform data and high‑speed mathematical computation are required.
Data Frame in R
Definition
A Data Frame is the backbone of Data Science in R. It is similar to Excel Sheets, SQL Tables, or CSV Files, allowing each column to hold different data types.
Creation
ID <- c('A','B','C')
Age <- c(21,22,20)
Height <- c(150,160,170)
sData <- data.frame(ID, Age, Height)
Naming Rows and Columns
rownames(sData) <- c('Ajith','John','Bob')
colnames(sData) <- c('ID','Age','Height')
Built‑in Functions
- str() – Structure overview
- head() – First rows
- tail() – Last rows
- summary() – Statistical overview
Dimensional Functions
- dim() – Rows & Columns
- nrow() – Number of rows
- ncol() – Number of columns
Accessing Data
sData$Age
sData[['Age']]
sData['Age']
Accessing Rows
sData['John', ]
Accessing Multiple Columns
sData[c('ID','Age')]
Comparison with Matrix
| Feature | Matrix | Data Frame |
|---|---|---|
| Data Type | Same | Different |
| Flexibility | Low | High |
| Real‑World Suitability | Medium | Very High |
Factor in R
Definition
A Factor is a categorical vector used to store limited unique values such as Gender, Blood Group, or Education Level.
Creation
gender <- factor(c('Male','Male','Female'))
Functions
levels(gender)
Importance
- Reduces memory usage
- Improves model efficiency
- Essential in classification problems
Lists in R
A List can hold multiple data types together, including vectors, matrices, and even other lists.
my_list <- list(1, "Text", TRUE)
Case Studies
Case Study 1 – Student Performance Analysis
A data frame stores Name, Marks, Attendance, and Grade. Factors are used for Grade classification.
Case Study 2 – Banking Customer Segmentation
Lists store mixed information; factors categorize customers into Silver, Gold, Platinum.
Case Study 3 – Healthcare Survey
Matrices store numeric lab results; data frames store patient records.
Mini Projects
Project 1 – Employee Database System
Create data frames with employee details and analyze salary distribution.
Project 2 – Sales Analysis Dashboard
Use factors for product categories and matrices for sales metrics.
Project 3 – Survey Data Processing
Use lists for raw responses and convert into structured data frames.
Advanced Statistical Usage
- Using matrices for regression coefficients
- Factors in logistic regression
- Data frames in ANOVA analysis
- Arrays in simulation modeling
Coding Exercises
- Create a 4×4 matrix and extract diagonal values.
- Build a data frame of 10 students.
- Convert a column into factor.
- Retrieve last three rows.
- Calculate average using matrix operations.
Common Beginner Mistakes
- Using matrix instead of data frame
- Ignoring factor conversion
- Not checking structure with
str() - Mixing data types unintentionally
Interview Questions
- Vector vs List?
- Matrix vs Data Frame?
- Role of Factors in ML?
- Purpose of
str()? - Dimensional functions?
- Access row vs column?
- Memory optimization using factor?
Practice Questions
- Create a data frame of 5 students with marks.
- Convert gender column to factor.
- Retrieve second row.
- Count columns using ncol().
- Display last two rows.
Conceptual Conclusion
Mastering R Data Types and Data Structures builds a strong analytical mindset, improves coding efficiency, and accelerates learning in Machine Learning, Data Visualization, and Advanced Statistics. These are not merely programming tools but intellectual frameworks for organizing and interpreting information intelligently.